Example: Solution to the Inverted Pendulum Problem Using
Frequency Response Method
Open-loop Representation
Closed-loop response with no compensation
Closed-loop response with compensation
What happens to the cart's position?
The transfer function of the plant for this problem is given below:
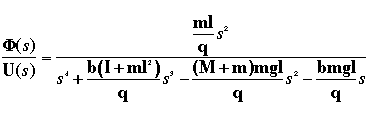

Note: There is a pole/zero cancellation in this transfer function.
In previous examples these were removed from the transfer function.
However, in this example they will be left in for reasons that
will become clear later.
The design criteria (with the pendulum receiving a 1N impulse force from
the cart) are:
- Settling time of less than 5 seconds.
- Pendulum should not move more than 0.05 radians away from the vertical.
To see how this problem was originally set up, consult the inverted pendulum modeling page.
Note: Before trying to work through this problem, it should be
noted that this is a complicated problem to solve with the frequency
response method. As you will soon find out, this problem has a pole in
the right-half-plane, making it unstable. The frequency response method
works best when the system is stable in the open loop. For this reason I
would not suggest trying to follow this example if you are trying to learn
how to use frequency response. This problem is for people who want to
learn how to solve frequency response problems that are more complicated.
Open-loop Representation
The frequency response method uses the bode command in Matlab to
find the frequency response for a system described by a transfer function
in bode form.
The transfer function found from the Laplace transforms for the output
Phi (the pendulum's angle)
can be set up using Matlab by inputting the numerator and denominator as
vectors. Create an m-file (or a '.m'
file located in the same directory as Matlab) and copy the following text to
model the transfer function:
M = .5;
m = 0.2;
b = 0.1;
i = 0.006;
g = 9.8;
l = 0.3;
q = (M+m)*(i+m*l^2)-(m*l)^2; %simplifies input
num = [m*l/q 0 0]
den = [1 b*(i+m*l^2)/q -(M+m)*m*g*l/q -b*m*g*l/q 0]
Your output should be:
num =
4.5455 0 0
den =
1.0000 0.1818 -31.1818 -4.4545 0
Closed-loop response with no compensation
We will now design an inverted pendulum controller for an impulse force
using Nyquist diagrams (we cannot use Bode plots because the system is unstable
in open loop).
Let's begin by looking at the block diagram for this system:

If you try to model this system in Matlab, you will have all sorts of
problems. The best way to use Matlab to solve this problem is to first
change the schematic to something that can be modeled much more easily.
Rearranging the picture, you can get the following new schematic:

Now we can begin our design. First, we will look at the poles and zeros
of this function:
x = roots(num)
y = roots(den)
x =
0
0
y =
0
-5.6041
5.5651
-0.1428
As you already know, we have a pole-zero cancellation at the origin, as well
as one positive, real pole in the right-half plane. This means that we
will need one anti-clockwise encirclement of -1 in order to have a stable
closed-loop system (Z = P + N; P = 1, N = -1). The following m-file will
be very useful for designing our controller. Please note that you will
need the function polyadd.m to run
this m-file. Copy and paste the function from your browser to a m-file in
your directory (make sure the function command starts in the first column
of the m-file).
Note: Non-standard Matlab commands used in this
example are highlighted in green.
function[ ] = pend()
clf
figure(1)
clf
%define TF
num = [4.5455 0 0];
den =[1.0000 0.1818 -31.1818 -4.4545 0];
figure(1)
%ask user for controller
numc = input('numc?.........');
denc = input('denc?.........');
k = input('K?............');
%view compensated system bode
bode(k*conv(numc,num), conv(denc,den))
%view compensated system nyquist
figure(2)
subplot (2,1,1)
nyquist(k*conv(numc,num), conv(denc,den))
%view compensated CL system impulse response
subplot(2,1,2)
clnum = conv(num,denc);
temp1 = k*conv(numc,num);
temp2 = conv(denc, den);
clden = polyadd(temp1,temp2);
impulse (clnum,clden)
Note: Matlab commands from the
control system toolbox
are highlighted in red.
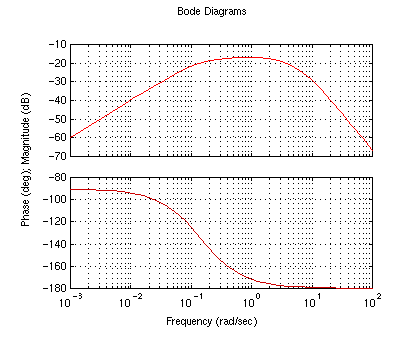
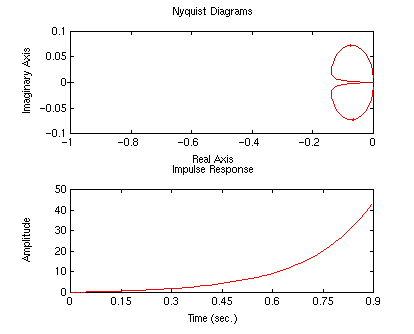
With this m-file we will now view the uncompensated system's Nyquist
diagram by setting the controller numerator, denominator and gain equal to
one. Enter pend at the command prompt, and enter 1 for numc,
denc, and K. You should see the following plots in your screen:
	numc?.........1
	denc?.........1
	K?............1
Closed-loop response with compensation
The system is unstable in closed loop (no encirclements of -1). Our first
step will be to add an integrator to cancel the extra zero
at the origin (we will then have two poles and two zeros at the origin).
Use the pend command again.
	numc?.........1
	denc?.........[1 0]
	K?............1
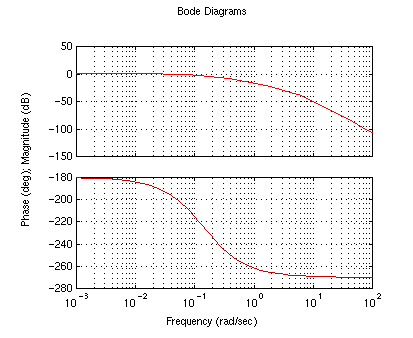
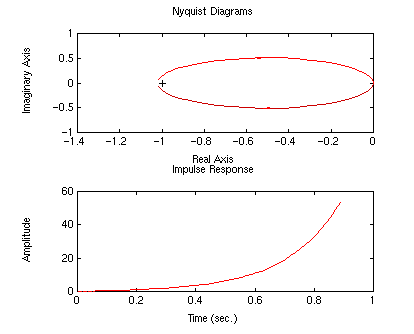
Notice that the nyquist diagram encircles the -1 point in a clockwise
fashion. Now we have two poles in the right-half plane (Z= P + N = 1 +
1). We need to add phase in order to get an anti-clockwise
encirclement. We will do this by adding a zero to our controller. For
starters, we will place this zero at -1.
	numc?.........[1 1]
	denc?.........[1 0]
	K?............1
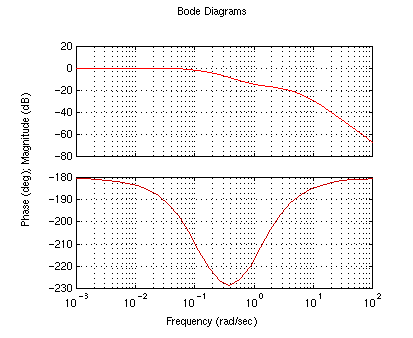
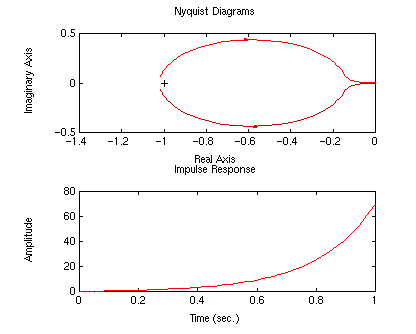
as you can see, this wasn't enough phase. The encirclement around -1 is
still clockwise. We are going to need to add a second zero.
	numc?.........conv([1 1],[1 1])
	denc?.........[1 0]
	K?............1
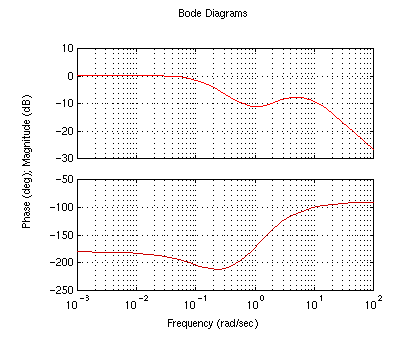
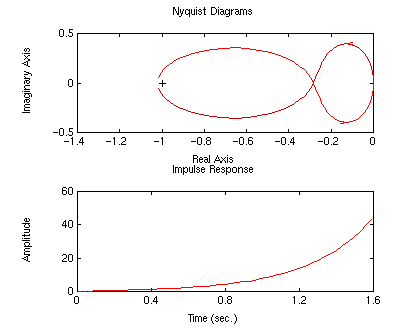
We still have one clockwise encirclement of the -1 point. However, if we
add some gain, we can make the system stable by shifting the nyquist plot
to the left, moving the anti-clockwise circle around -1, so that N = -1. help
impulse
	numc?.........conv([1 1],[1 1])
	denc?.........[1 0]
	K?............10
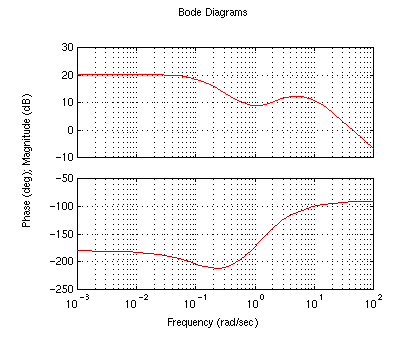
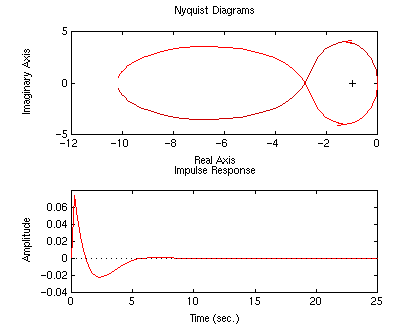
As you can see, the system is now stable. We can now concentrate on
improving the response. We can modify the poles of the controller in
order to do this. We have to keep in mind that small poles (close to the
origin) will affect the response at small frequencies, while larger poles
(farther from the origin) will affect the response at high frequencies.
When designing via frequency response, we are interested in obtaining
simple plots, since they will be easier to manipulate in order to achieve
our design goal. Therefore, we will use these concepts to 'flatten' the
frequency response (bode plot). At the same time, you will notice that
the nyquist diagram will take an oval shape.
If we try different combinations of poles and gains, we can get a very
reasonable response. (Enter the command axis([0 5 -0.05 0.1])
after the pend command.)
	numc?.........conv([1 1.1],[1 5])
	denc?.........[1 0]
	K?............10
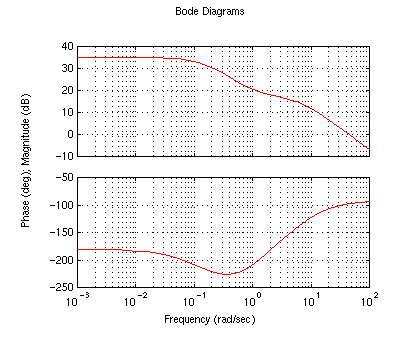
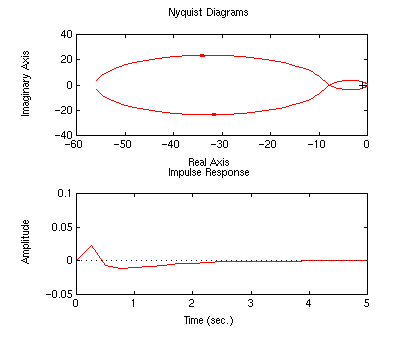
Our response has met our design goals.
Feel free to vary the
parameters and observe what happens.
What happens to the cart's position?
At the beginning on this solution page, the block diagram for this problem
was given. The diagram was not entirely complete. The block representing
the the position was left out because that variable was not being
controlled.
It is interesting though, to see what is happening to the cart's
position when the controller for the pendulum's angle is in place. To see
this we need to consider the actual system block diagram:
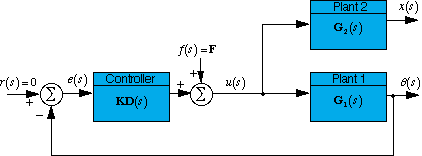
Rearranging a little bit, you get the following block diagram:

The feedback loop represents the controller we have designed
for the pendulum. The transfer
function from the cart's position
to the impulse force, with the frequency response feedback controller
which we designed,
is given as follows:

Recall that den1=den2 (the two transfer functions G1 and G2 differ in numerator
alone), so the transfer function from X to F can be simplified to:

Now that we have the transfer function for the entire system,
let's take a look at the
response. First we need the transfer function for the cart's
position. To
get this we need to go back to the laplace transforms of the
system
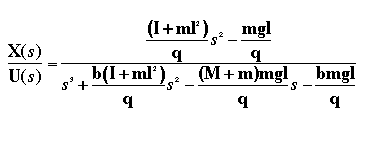
equations and find the transfer function from X(s) to
U(s).
Below is this transfer function:

For more about the Laplace transform please refer to the inverted pendulum modeling page.
The pole/zero at the origin canceled out
of the transfer function for Phi, has been put back in. So that
now den1 =
den2, making calculations easier.
Now, create a new m-file and run it in the command window:
M = .5;
m = 0.2;
b = 0.1;
i = 0.006;
g = 9.8;
l = 0.3;
q = (M+m)*(i+m*l^2)-(m*l)^2; %simplifies input
num1 = [m*l/q 0 0];
den1 = [1 b*(i+m*l^2)/q -(M+m)*m*g*l/q -b*m*g*l/q 0];
num2 = [(i+m*l^2)/q 0 -m*g*l/q];
den2 = den1;
k = 10;
numcontroller = conv([1 1.1],[1 5]);
dencontroller = [1 0];
numc = conv(numx,dencontroller);
denc = polyadd(conv(dencontroller,den),k*conv(numcontroller,num));
t=0:0.01:100;
impulse(numc,denc,t)
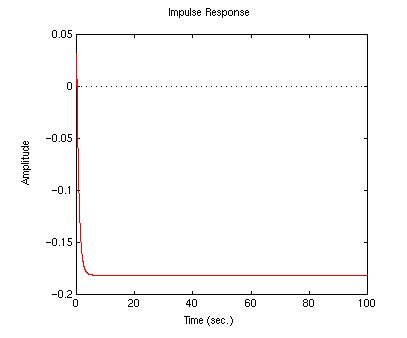
As you can see, the cart moves in the negative direction and stabilizes at
about -0.18 meters. This design might work pretty well for the
actual controller, assuming that the cart had that much room to move in.
Keep in mind, that this was pure luck. We were not
trying to design to stabilize the cart's position, and the fact that we have is
a fortunate side effect.
User Feedback
-
Frequency Response Examples
-
Cruise Control |
Motor Speed |
Motor Position |
Bus Suspension |
Inverted Pendulum |
Pitch Controller |
Ball & Beam
-
Inverted Pendulum Examples
-
Modeling |
PID |
Root Locus |
Frequency Response |
State Space |
Digital Control
-
-
Tutorials
-
Basics |
Modeling |
PID |
Root Locus |
Frequency Response |
State Space |
Digital Control |
Examples


8/12/97 CJC
